




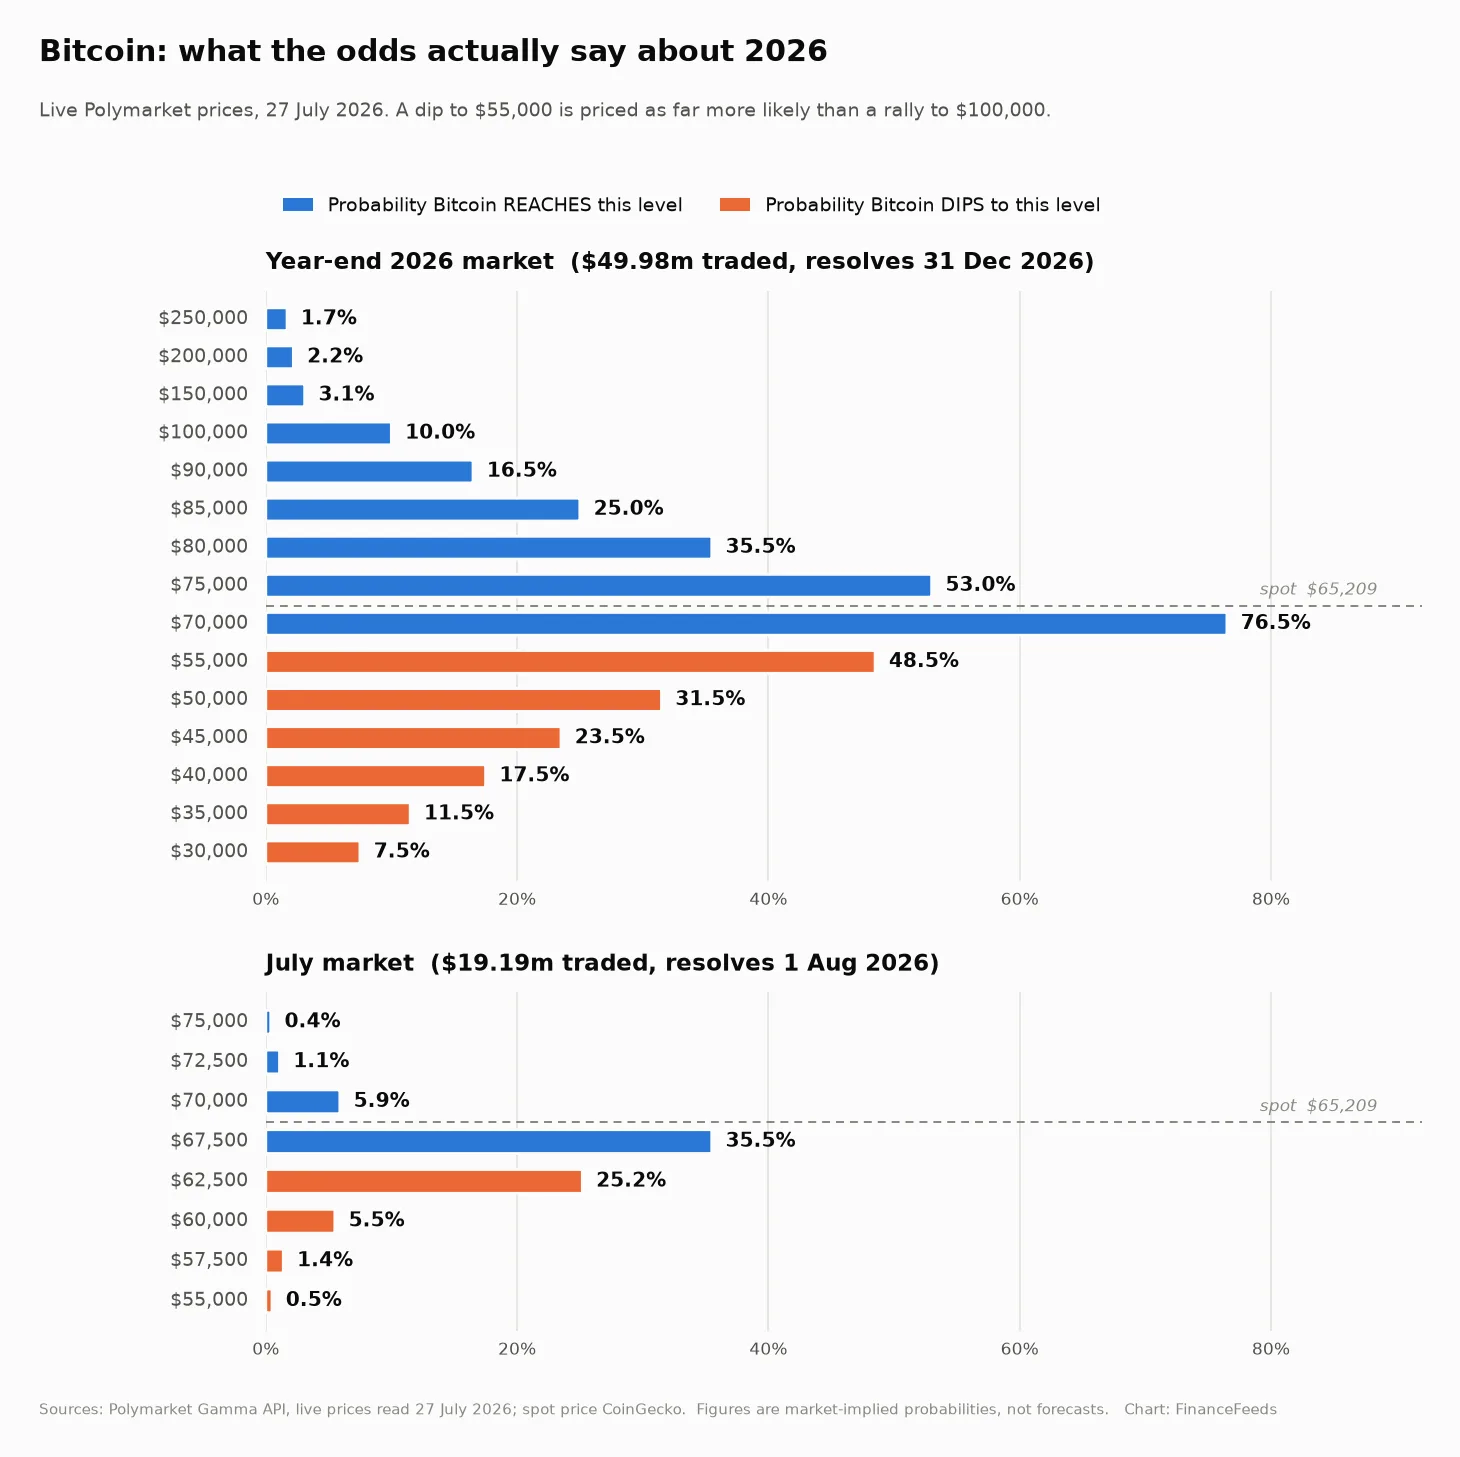

Every Bitcoin price prediction you have read this month is a round number attached to a confident voice. $150,000. $250,000. $1 million. What almost none of them carry is a probability, which is the only part that would let you check the claim. So here is the same question asked of people with money at stake instead of an audience: as of July 27, 2026, with Bitcoin at $65,209, roughly $50 million of live trading on Polymarket’s year-end market prices $100,000 by December 31 at just 10.0%, $150,000 at 3.1% and $250,000 at 1.7%. Against that, a dip to $55,000 is priced at 48.5% — very nearly a coin flip. The market is not forecasting a moonshot. It is pricing a drawdown as roughly five times more likely than the six-figure target that dominates the headlines.
That inversion is the story, and it is checkable in a way no target ever is. A price target is an assertion; an odds line is a position someone has funded. The single most useful number in the whole market is not a target at all — it is the level where the probability crosses 50%, because that is where the market stops leaning. On the year-end book that level sits at about $75,000, priced at 53.0%. In other words, the honest market-implied Bitcoin price prediction for 2026 is not $250,000 and not $30,000. It is “a bit higher than today, with a fat and genuinely likely downside tail.” Everything below works through how that distribution is built, where it could be wrong, and why it disagrees so violently with the published targets.
Key facts
- Bitcoin price: $65,209 on July 27, 2026, up 1.15% on the day and 8.09% over 30 days, but down 44.87% over a year — CoinGecko
- Drawdown: 48.28% below the all-time high of $126,080 set on October 6, 2025; market capitalisation about $1.31 trillion — CoinGecko
- Year-end market size: roughly $49.98 million traded on Polymarket’s “What price will Bitcoin hit in 2026?” book, which resolves December 31, 2026 — Polymarket
- Upside odds by December 31, 2026: $70,000 at 76.5%, $75,000 at 53.0%, $80,000 at 35.5%, $90,000 at 16.5%, $100,000 at 10.0%, $150,000 at 3.1%, $250,000 at 1.7%, $1,000,000 at 0.9%
- Downside odds by December 31, 2026: a dip to $55,000 at 48.5%, $50,000 at 31.5%, $45,000 at 23.5%, $40,000 at 17.5%, $35,000 at 11.5%, $30,000 at 7.5%
- New all-time high in 2026: priced at just 5.9% on a separate $9.39 million book — Polymarket
- Near term: on the $19.19 million July book resolving August 1, reaching $67,500 is 35.5% and dipping to $62,500 is 25.2%
What $50 million of real money is actually pricing
Prediction-market prices are not forecasts in the way an analyst note is a forecast. A contract trading at 10 cents pays $1 if the event happens, so the price is the market’s collective estimate of the probability, net of fees and the cost of tying up capital. That makes the whole book readable as a probability distribution rather than a single guess, which is exactly what a price target cannot give you.
Read across the year-end ladder and the shape is clear. The market treats a modest recovery as the base case: $70,000 — about 7.3% above spot — is priced at 76.5%, so traders overwhelmingly expect Bitcoin to touch that level at some point before December 31. From there conviction falls away quickly. $80,000 is a 35.5% shot. $90,000 is 16.5%. By $100,000 the market is down to 10.0%, and the popular $150,000 and $250,000 targets sit at 3.1% and 1.7% respectively.
The asymmetry against the downside ladder is the part worth sitting with. A dip to $55,000 — only about 15.7% below spot — is priced at 48.5%. That single number is 4.9 times the probability assigned to $100,000 and 15.6 times the probability assigned to $150,000. Even a fall to $45,000, which would be a 31% drawdown from here and roughly 64% below the 2025 high, is priced at 23.5% — more than twice as likely as Bitcoin reaching $100,000.
One more market makes the point bluntly. A separate book asks simply whether Bitcoin sets a new all-time high before the end of 2026. It is priced at 5.9%. Whatever the cycle models say, the traders funding these positions are assigning roughly a 94% chance that 2026 ends without Bitcoin exceeding $126,080.
There is a useful cross-check available, because Polymarket runs a second, entirely separate book asking when Bitcoin will hit $150,000. That market has traded about $27.09 million on its own, and it prices $150,000 by December 31, 2026 at 3.7%. The year-end ladder prices the same outcome at 3.1%. Two independently traded books, with different participants and different structures, landing within 0.6 percentage points of each other is meaningful: it suggests the number is a genuine consensus rather than an artefact of one thin market. When the headline targets disagree with one book you can argue liquidity; when they disagree with two, the burden shifts.
The coin-flip line is about $75,000
The chart below plots the full distribution: the probability Bitcoin reaches each level, and the probability it dips to each level, for both the year-end and the near-term July book.
The same year-end figures in table form:
| Level | Move from $65,209 | Probability Bitcoin reaches it by Dec 31, 2026 |
|---|---|---|
| $250,000 | +283% | 1.7% |
| $200,000 | +207% | 2.2% |
| $150,000 | +130% | 3.1% |
| $100,000 | +53% | 10.0% |
| $90,000 | +38% | 16.5% |
| $80,000 | +23% | 35.5% |
| $75,000 | +15% | 53.0% — the coin-flip line |
| $70,000 | +7% | 76.5% |
If you want one number to carry away, it is $75,000. That is where the market stops leaning in either direction, and it implies a year-end zone modestly above spot rather than a repeat of 2021 or 2024. Note also how compressed the far right tail is: the gap in probability between $150,000 (3.1%) and $250,000 (1.7%) is only 1.4 percentage points, and $1,000,000 still carries 0.9%. Beyond about $150,000 the market is essentially pricing lottery tickets, and the difference between one lottery ticket and another is close to noise. Anyone quoting a $250,000 target should be asked why it deserves more weight than the 1.7% the market gives it.
The downside ladder deserves the same scrutiny, because it does not describe a market braced for collapse. Below $55,000 the probabilities fall away steadily: $45,000 is 23.5%, $40,000 is 17.5%, $35,000 is 11.5% and $30,000 is 7.5%. Push further and the tail thins to almost nothing — $25,000 is 4.0% and $15,000 is 1.9%. So the distribution is skewed downward in its middle but not catastrophic at its edge. The market’s position, stated plainly, is that a further 15% to 30% drawdown is a live and well-funded possibility, while a true collapse toward the levels that would break the asset class as an institutional holding is not being priced at all. That is a different claim from either the maximalist or the doomer case, and it sits closer to how Bitcoin now behaves against gold and the S&P 500 than to its earlier boom-and-bust identity.
Why the odds are set this low
Context explains most of it. Bitcoin is 48.28% below its October 6, 2025 peak of $126,080 and down 44.87% over the past year. Reaching $100,000 does not just require a 53% rally; it requires recovering most of a drawdown that has persisted for the better part of nine months. Markets price persistence, and a level that has been rejected repeatedly gets discounted.
The near-term book shows the same caution at higher resolution. On the July market, which resolves August 1, reaching $67,500 — a move of just 3.5% — is priced at only 35.5%, while dipping to $62,500 is 25.2%. Traders are not even confidently pricing a 3.5% bounce over the remaining days of the month, which tells you how little momentum is being credited despite the 8.09% gain over the past 30 days.
Sentiment matches the pricing. The mood in retail communities is closer to exhaustion than euphoria, and the most upvoted responses to cycle-based bull arguments are openly derisive: one widely upvoted reply to a cycle-timing thread ran, “World cup cycles as market indicators now? We’ve reached peak degen analysis and I’m here for it. The 2022 bottom lines up nice but pretending 2026 will repeat the pattern is some serious hopium.” That is not a rigorous argument, but it is a fair description of how thin the evidence behind most cycle-repeat claims actually is.
Not every named voice is bearish on the same timeline. Veteran trader Peter Brandt has publicly argued that Bitcoin will bottom on October 4, which would place a floor inside the current calendar year and leave a window for recovery into December. A dated bottom call and a 53% coin-flip line at $75,000 are not actually in conflict — both describe a market that goes lower before it goes meaningfully higher.
Where this framework breaks
Prediction-market odds are better evidence than a target, but they are not truth, and three caveats matter.
First, these markets can be gamed. FinanceFeeds has reported on a study finding signs of manipulation in Bitcoin bets on Polymarket, and thin books at the extremes are the easiest to distort. The $70,000 and $75,000 contracts carry real depth; the $1,000,000 contract does not, and a 0.9% price there should be read as a rounding artefact rather than a considered estimate.
Second, “reach” and “dip” markets are path-dependent, not terminal. A 48.5% chance of dipping to $55,000 does not mean a 48.5% chance of ending the year at $55,000 — it means the market thinks there is roughly a coin flip that price touches that level at any point. The same is true of the upside ladder. This is why the two ladders can both look heavy without contradiction, and it is the most common misreading of these books.
Third, probability is not volatility. Options markets price the width of the distribution directly, and comparing the two is its own exercise — one worth doing alongside the implied versus historical volatility picture rather than in isolation. A market can be right about direction and badly wrong about the size of the move.
It is also worth noting who is now watching these books. Prediction markets have crossed over into mainstream financial commentary precisely because they compress sentiment into a single number: as one widely viewed creator put it this month, the value “isn’t about necessarily putting money and or betting money in Polymarket… but it’s actually becoming a really good source of information and data to invest.” That is the correct use of this data, and also its limit.
What happens next
One: watch the $75,000 contract, not the price. It is the market’s own confidence gauge. If the 53.0% line drifts toward 70%, the distribution has shifted upward and every target above it re-rates with it. If it falls under 40%, the base case has moved from recovery to continued drawdown.
Two: the $55,000 dip contract is the honest risk gauge. At 48.5% it is currently the single most probable material move in the entire book. Any argument for six figures in 2026 has to explain why that contract is mispriced, and most published targets never engage with it at all.
Three: expect the all-time-high market to lead. At 5.9%, the new-high contract has the most room to move on a genuine trend change. It will re-rate before the $100,000 contract does, because it is the cleanest expression of “the regime has changed.”
None of this makes the bulls wrong. It makes them quantified. A $250,000 call is not absurd — it is a 1.7% bet, and 1.7% events happen. The failure is not the target; it is publishing the target without the probability attached, which is precisely what the market supplies for free.
Frequently asked questions
What is the Bitcoin price prediction for 2026?
The market-implied answer is roughly $75,000. On Polymarket’s year-end book, $75,000 carries a 53.0% probability — the level where the odds stop leaning either way. $70,000 is priced at 76.5%, while $100,000 sits at 10.0% and $150,000 at 3.1%, all against a spot price of $65,209 on July 27, 2026.
Will Bitcoin hit $100,000 in 2026?
The market prices it at 10.0% by December 31, 2026, on roughly $50 million of trading. That is not zero, but it is roughly one chance in ten. For comparison, a dip to $55,000 is priced at 48.5% — about 4.9 times more likely than Bitcoin reaching $100,000 over the same window.
Will Bitcoin reach a new all-time high in 2026?
Polymarket prices a new all-time high before the end of 2026 at just 5.9%, on a separate book of about $9.39 million. Bitcoin would need to exceed $126,080, the record set on October 6, 2025. It currently trades 48.28% below that level.
Why is Bitcoin down so much?
Bitcoin is down 44.87% over a year and 48.28% below its October 2025 peak, though it has recovered 8.09% over the past 30 days. The drawdown has persisted for roughly nine months, which is the main reason markets discount a rapid return to six figures rather than pricing a fast recovery.
Are Polymarket odds reliable for price predictions?
They are evidence, not truth. Deep contracts near spot carry real money and are informative; extreme contracts are thin and easily distorted, and research has found signs of manipulation in Bitcoin bets on the platform. They also measure whether a level is touched at any point, not where price finishes.
What price will Bitcoin hit in July 2026?
On the July book resolving August 1, reaching $67,500 is priced at 35.5% and $70,000 at 5.9%, while a dip to $62,500 is 25.2%. With spot at $65,209, the market is not confidently pricing even a 3.5% move higher in the remaining days of the month.
This article is informational analysis and does not constitute investment advice. All probabilities are live market prices read on July 27, 2026 and change continuously; prediction-market contracts measure whether a level is touched, not where price settles. Cryptocurrency is volatile and capital is at risk. Do your own research before making any investment decision.
{“@context”: “https://schema.org”, “@type”: “FAQPage”, “mainEntity”: [{“@type”: “Question”, “name”: “What is the Bitcoin price prediction for 2026?”, “acceptedAnswer”: {“@type”: “Answer”, “text”: “The market-implied answer is roughly $75,000. On Polymarket’s year-end book, $75,000 carries a 53.0% probability — the level where the odds stop leaning either way. $70,000 is priced at 76.5%, while $100,000 sits at 10.0% and $150,000 at 3.1%, all against a spot price of $65,209 on July 27, 2026.”}}, {“@type”: “Question”, “name”: “Will Bitcoin hit $100,000 in 2026?”, “acceptedAnswer”: {“@type”: “Answer”, “text”: “The market prices it at 10.0% by December 31, 2026, on roughly $50 million of trading. That is not zero, but it is roughly one chance in ten. For comparison, a dip to $55,000 is priced at 48.5% — about 4.9 times more likely than Bitcoin reaching $100,000 over the same window.”}}, {“@type”: “Question”, “name”: “Will Bitcoin reach a new all-time high in 2026?”, “acceptedAnswer”: {“@type”: “Answer”, “text”: “Polymarket prices a new all-time high before the end of 2026 at just 5.9%, on a separate book of about $9.39 million. Bitcoin would need to exceed $126,080, the record set on October 6, 2025. It currently trades 48.28% below that level.”}}, {“@type”: “Question”, “name”: “Why is Bitcoin down so much?”, “acceptedAnswer”: {“@type”: “Answer”, “text”: “Bitcoin is down 44.87% over a year and 48.28% below its October 2025 peak, though it has recovered 8.09% over the past 30 days. The drawdown has persisted for roughly nine months, which is the main reason markets discount a rapid return to six figures rather than pricing a fast recovery.”}}, {“@type”: “Question”, “name”: “Are Polymarket odds reliable for price predictions?”, “acceptedAnswer”: {“@type”: “Answer”, “text”: “They are evidence, not truth. Deep contracts near spot carry real money and are informative; extreme contracts are thin and easily distorted, and research has found signs of manipulation in Bitcoin bets on the platform. They also measure whether a level is touched at any point, not where price finishes.”}}, {“@type”: “Question”, “name”: “What price will Bitcoin hit in July 2026?”, “acceptedAnswer”: {“@type”: “Answer”, “text”: “On the July book resolving August 1, reaching $67,500 is priced at 35.5% and $70,000 at 5.9%, while a dip to $62,500 is 25.2%. With spot at $65,209, the market is not confidently pricing even a 3.5% move higher in the remaining days of the month.”}}]}